screenshot.png
Description
AipocsHouse ModProfiler
A low-overhead statistical CPU and allocation profiler for Hytale Java mods.
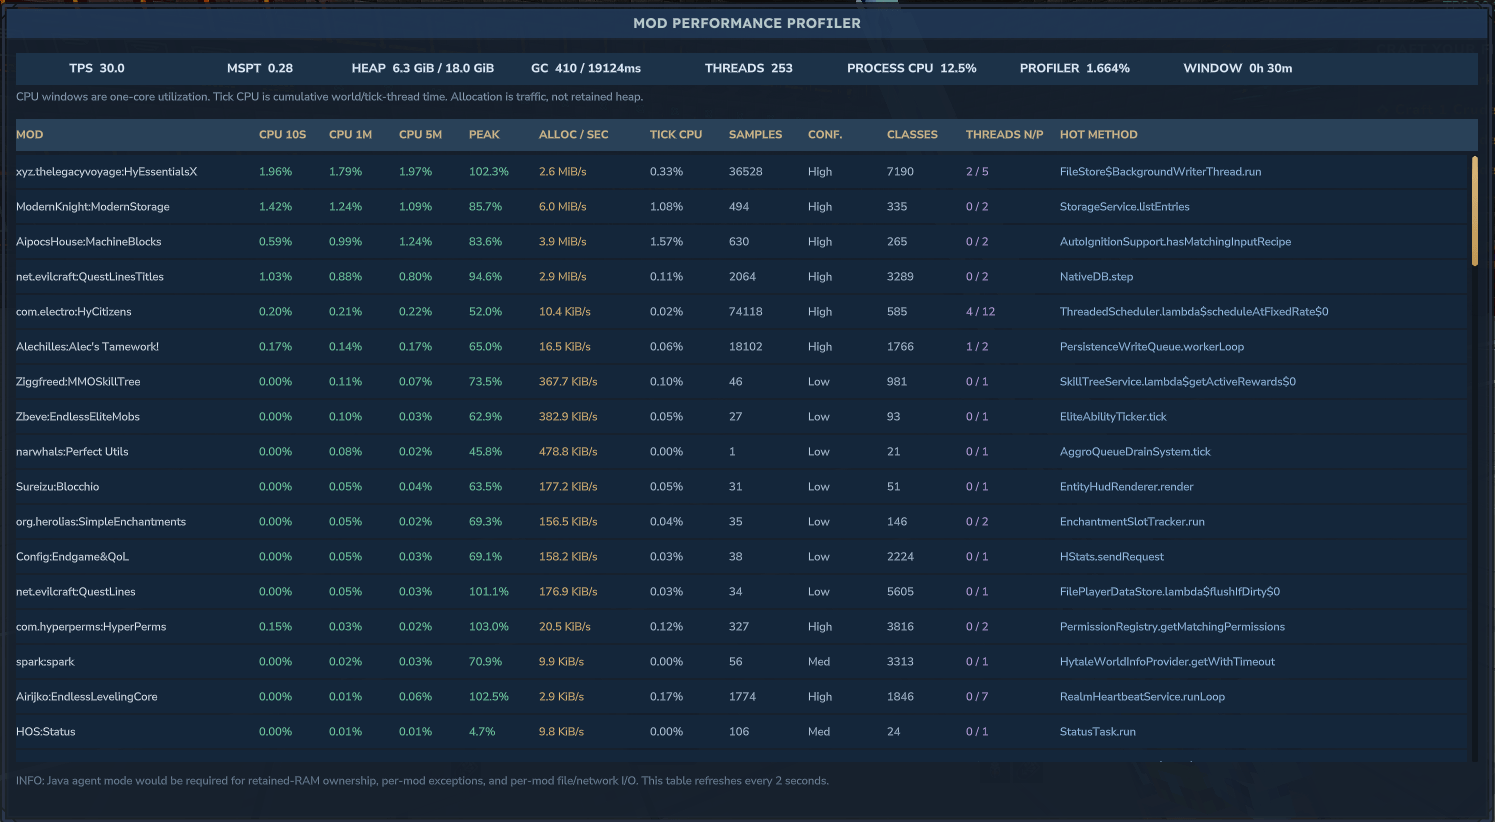
ModProfiler samples JVM thread activity every 100 ms, attributes visible stack frames to loaded mod JARs, and stores statistics in a temporary in-memory SQLite database. No JSON statistics files are written, and all collected data is discarded when the server stops.
Features
- In-game profiler GUI with automatic two-second refresh
- Full-height scrolling table for loaded non-Hytale Java mods
- Sorting by one-minute CPU, then one-minute allocation rate, then tick CPU
- CPU averages for the last 10 seconds, one minute, and five minutes
- Peak sampled CPU
- Allocation rate per second
- World/tick-thread CPU attribution
- Current and peak sampled thread counts per mod
- Sample count and confidence rating
- Loaded class count
- Hottest sampled method
- Server TPS and MSPT
- JVM heap, garbage collection, and live thread statistics
- Whole-process CPU and profiler-overhead reporting
- Plain-English wrapped mouseover help for every metric
- Console top-mod report once per minute
Commands
/profiler— open the profiler GUI/modprofiler— alias for/profiler/profiler reset— clear collected statistics/profiler rescan— rebuild loaded-mod class ownership
The /modprofiler alias also supports the reset and rescan actions.
Permission
aipocshouse.modprofiler.use
Hytale server operators receive access through the default permission system. HyperPerms and LuckPerms/LuckyPerms can grant the same node to an administrator group because the command uses Hytale's central PermissionHolder check.
Understanding the numbers
- CPU percentages use one-core utilization:
100%means one CPU core was fully occupied. ALLOC / SECis the rate at which a mod creates Java objects. It is memory traffic, not retained RAM ownership.THREADS N/Pmeans distinct sampled threads now and the highest observed count. Shared Hytale or executor threads can appear for multiple mods.- Sampling is statistical. Very short work between samples can be missed.
- Shared-library frames can be attributed to the nearest visible owning mod frame.
A normal Hytale plugin cannot reliably measure retained heap ownership, every thrown exception, or exact per-mod file/network I/O. Those measurements require deeper JVM-agent instrumentation and substantially more overhead.
The ModProfiler Team